
Building & Energy
How Energy & Utility Management Improves Visibility Across Building Operations
Utility data is easy to collect and hard to use. Centralized monitoring is what turns a set of meter readings into something a facility team can act on.
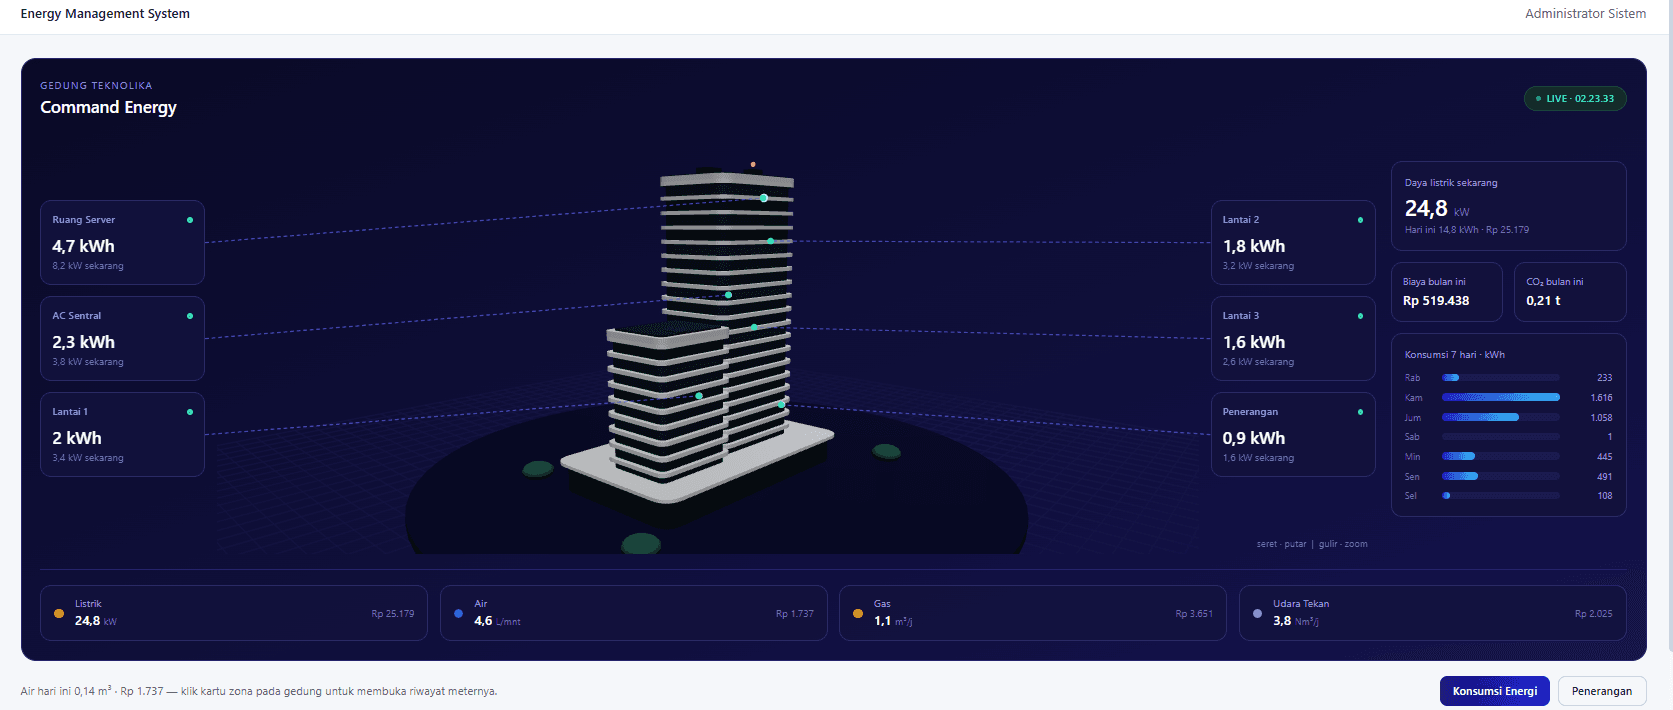
Centralized energy and utility monitoring across a building.
On This Page
Most facilities already measure their utilities. Meters exist, bills arrive, and consumption is known at the level of a monthly total. What is often missing is the shape of that consumption — where it occurs, when it occurs, and how much any particular area contributes.
Energy and utility management is the practice of making that shape visible. This article covers what such a system monitors, why the visibility matters, and how consumption data becomes operational insight.
Understanding Energy & Utility Management
An energy and utility management system provides centralized monitoring of consumption across a facility. Rather than each utility being read in isolation, consumption is brought into one environment where it can be compared, tracked, and reported.
The system does not reduce consumption by itself. It makes consumption legible, which is the precondition for anything else.
Why Utility Visibility Matters
A monthly total answers one question: how much. It cannot answer where, or when, or whether this month resembles last month for a reason worth investigating.
Attribution is what allows a facility team to ask sharper questions. An unexpected figure stops being a number on a bill and becomes a specific area on a specific day.
What Utilities Can Be Monitored?
- Electricity
- Electrical consumption across the facility and its operating areas.
- Water
- Water usage measured alongside other utilities rather than separately.
- Gas
- Gas consumption monitored from the same environment.
- Other measurable utilities
- Additional utilities the facility meters, such as compressed air.
From Consumption Data to Operational Insight
Once consumption is centralized, it can be read at more than one level. A building total gives the overall picture; a breakdown by zone shows which parts of the facility account for it.
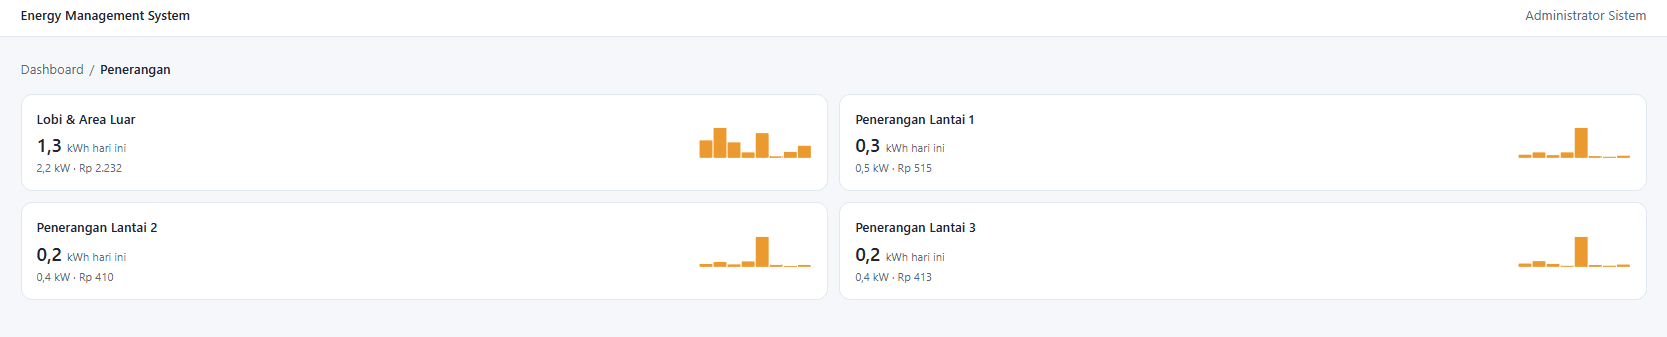
The same data supports both readings. The difference is only whether the question being asked is about the building or about a part of it.
Identifying Inefficiencies
Inefficiency is usually visible as a pattern rather than a single reading: an area consuming outside its operating hours, a load that does not fall when the space empties, a figure that has drifted upward without an obvious cause.
None of these are detectable from a monthly total. All of them are detectable when consumption is tracked continuously and attributed to a place.
Supporting Utility Cost Management
Where cost is shown alongside consumption, the two can be read together rather than reconciled afterwards. That supports better visibility over what the facility is spending on utilities and where that spend originates.
Energy Visibility Across Buildings, Departments, and Tenants
The same principle scales. Consumption attributed by operating area supports understanding across a facility; the same attribution supports understanding across departments or tenants where a building is shared.
What is possible in a given deployment depends on how the facility is metered and how the system is configured for it.
Supporting Sustainability Initiatives
Sustainability work depends on measurement. An organization cannot demonstrate a change in resource use without a consistent record of what that use was before and after.
Centralized utility monitoring supports better resource management and sustainability initiatives by providing that record. The outcomes themselves depend on what the organization does with it.
Conclusion
Energy and utility management is less about the data being collected — most facilities already collect it — and more about it being brought together. Visibility across electricity, water, gas, and other measurable utilities is what allows consumption to inform an operational decision rather than simply appear on a bill.