
Energy & Utility Management System
Turn Utility DataIntoBetter Decisions.
Centralized energy and utility monitoring that helps organizations understand consumption, improve visibility, manage costs, and support better operational decisions.
Centralized Utility Visibility
Understand What Your Facility Consumes.
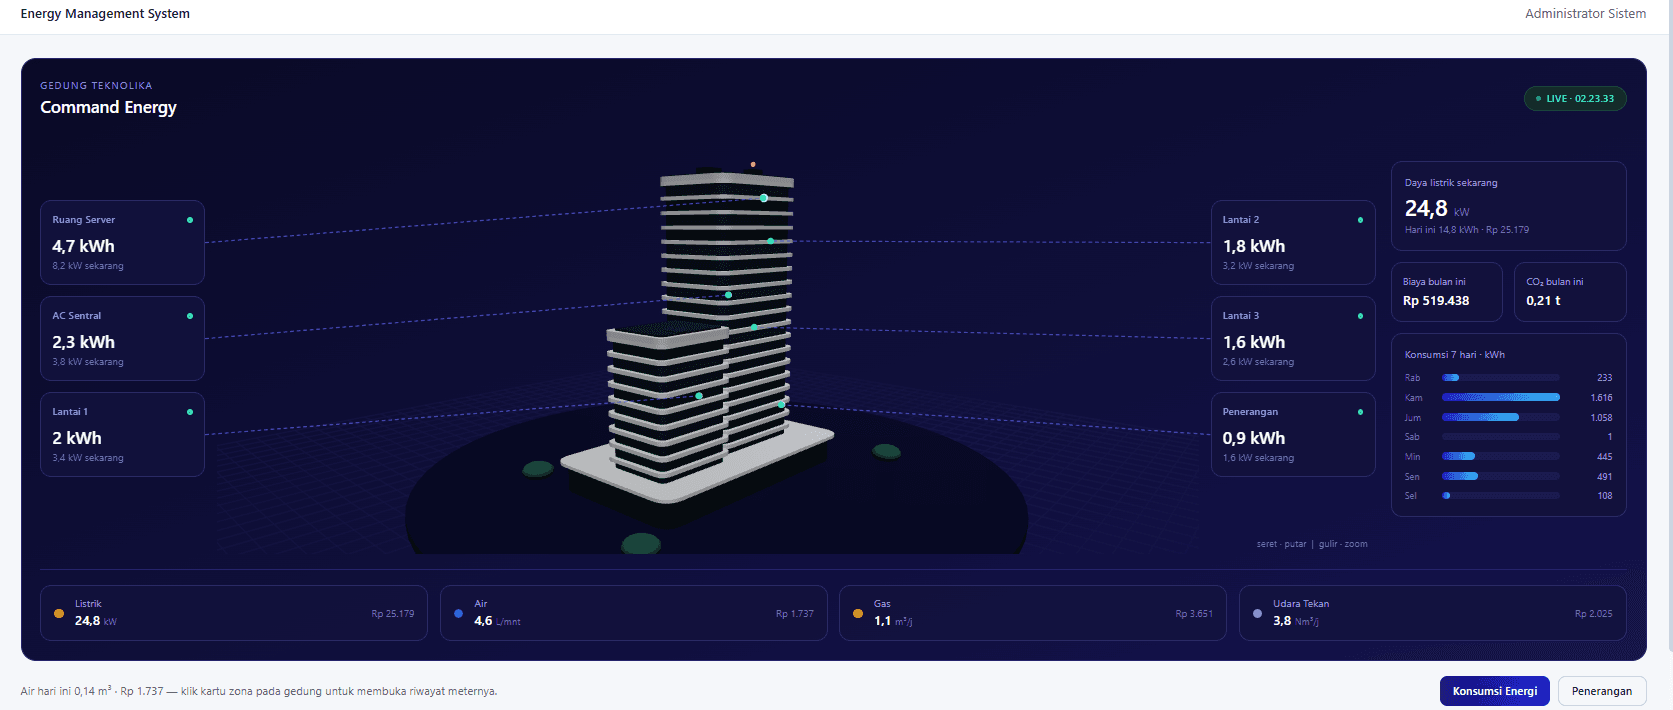
Conceptual overview of what the system brings together, not a technical architecture.
Understand Your Consumption.
Where is energy being consumed?
When is it being consumed?
How much is being consumed?
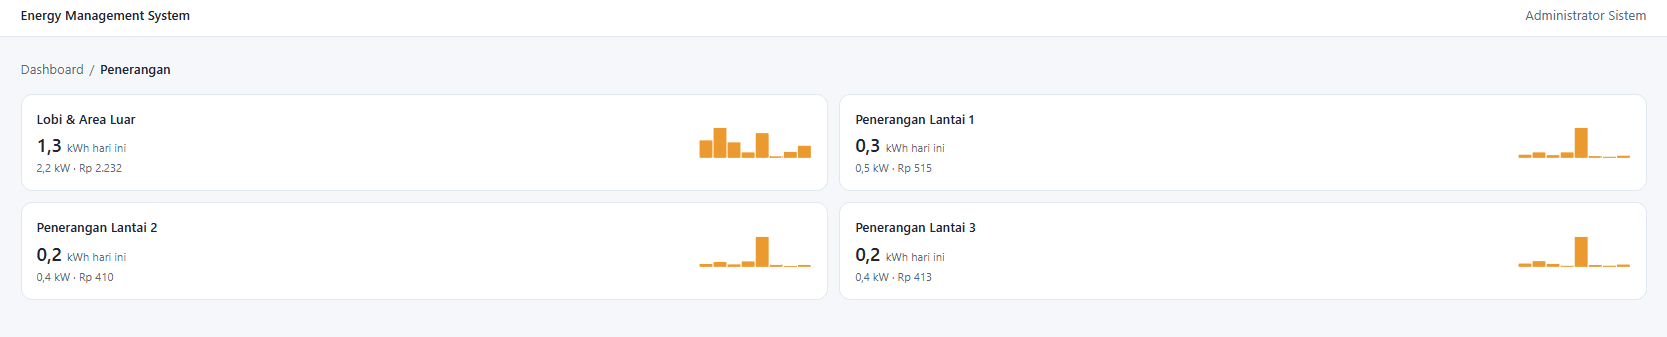
Detail view — Lighting
One Centralized View
Monitor Energy and Utilities Across Your Operational Environment.
Consumption does not stay at building level. It breaks down by area.
Lighting is monitored per area and per floor, each with its own daily consumption, current load, and cost for the day.
Monitoring Experience
From the facility to the decision.
- 01Facility
- 02Utility Sources
- 03Monitoring
- 04Centralized Dashboard
- 05Operational Visibility
A conceptual view of how monitoring reaches the operating team, not a technical architecture.
What You Can Monitor
Designed for Operational Visibility.
Annotations refer to information visible in the interface.
From Data to Better Decisions
Visibility First. Decisions Follow.
Understand energy and utility consumption.
Identify areas of inefficient usage.
Improve visibility over energy and utility costs.
Understand consumption across operational areas.
Support better resource management and sustainability initiatives.
Connected Solutions
Explore Related Teknolika Solutions.
Turn Consumption DataInto Better Operational Decisions.
Discover how Energy & Utility Management System can improve visibility across your facility’s energy and utility consumption.